
What is linear regression?
Linear regression is a statistical technique that identifies the relationship between the mean value of one variable and the corresponding values of one or more other variables. By understanding the relationship between variables, the linear regression technique can help data scientists model and predict how one variable will change in relation to another. This can involve analyses such as estimating sales based on product prices or predicting crop yield based on rainfall. At a basic level, the term regression means to return to a former or less developed state.
Linear regression in machine learning (ML) builds on this fundamental concept to model the relationship between variables using various ML techniques to generate a regression line between variables such as sales rate and marketing spend. In practice, ML tends to be more useful when working with multiple variables, called multivariate regression, where the relationships between them require more complex regression coefficients.
Linear regression is a basic component in supervised learning. At its core, it can help determine if one explanatory variable can provide value in predicting the outcome of the other. For example, does ad spending on one medium or another have any meaningful impact on sales?
In the most basic case, linear regression tries to predict the value of one variable, called the dependent variable, given another variable, called the independent variable. For example, if an organization was trying to predict sales rate based on advertising spend, sales would be the dependent variable, while ad spend would be the independent variable.
This article is part of
What is machine learning? Guide, definition and examples
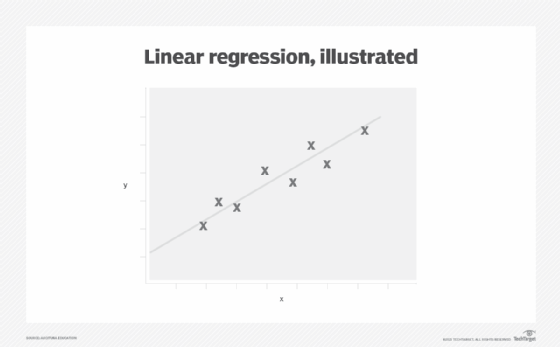
Linear regression is linear in that it guides the development of a function or model that fits a straight line -- called a linear regression line -- to a graph of the data. This line also minimizes the difference between a predicted value for the dependent variable given the corresponding independent variable.
In the case of estimating sales rate, each dollar in sales might climb regularly within a certain range for every dollar spent on ads and then slow down once the ad market reaches a saturation point. In these cases, more complex functions need to be constructed using statistics or ML techniques to fit the data onto a straight line.
Why is linear regression important?
Linear regression is important for the following reasons:
- It works with unlabeled data.
- It's relatively simple and fast.
- It can be applied as a fundamental building block in business and science.
- It supports predictive analytics.
- It's readily applied to ML models.
Types of linear regression
There are three main types of linear regression:
- Simple linear regression. Simple linear regression finds a function that maps data points to a straight line onto a graph of two variables.
- Multiple linear regression. Multiple linear regression finds a function that maps data points to a straight line between one dependent variable, like ice cream sales, and a function of two or more independent variables, such as temperature and advertising spend.
- Nonlinear regression. Nonlinear regression finds a function that fits two or more variables onto a curve rather than a straight line.
Beyond these three fundamental categories, however, there are numerous specific linear regression methods, which include the following:
- Hierarchical linear modeling (HLM).
- Lasso regression.
- Logistic regression.
- Ordinal regression.
- Ordinary least squares.
- Partial least squares regression.
- Polynomial regression.
- Principal component regression.
- Quantile regression.
- Ridge regression.
- Structural equation modeling.
- Tobit regression.
Each specific approach can be applied to different tasks or data analysis objectives. For example, HLM -- also called multilevel modeling -- is a type of linear model intended to handle nested or hierarchical data structures, while ridge regression can be used when there's a high correlation between independent variables, which might otherwise lead to unintended bias using other methods.
Examples of linear regression
The following highlights three common ways linear regression is used:
- It can be used to identify the magnitude of the effect an independent variable, like temperature, might have on a dependent variable like ice cream sales.
- It can be used to forecast the impact of changes driven by the independent variable -- for example, how much more ice cream might be sold with different levels of advertising.
- It can be used to predict trends and future values -- like how much ice cream should be stocked to meet demand if the temperature is predicted to reach 90 degrees Fahrenheit.
Linear regression use cases
Typical use cases for linear regression in business include the following:
- Pricing elasticity. How much will sales drop if the price is increased by a given amount?
- Risk management. What is the anticipated liability for a given storm strength?
- Commodities futures. What is the relationship between rainfall and crop yield?
- Fraud detection. What is the probability of a transaction being fraudulent?
- Business analysis. How much could sales rise with various levels of profit-sharing incentives?
Advantages and disadvantages of linear regression
Advantages of linear regression include the following:
- It aids in exploratory data analysis.
- It can identify relationships between variables.
- It's relatively straightforward to implement.
Disadvantages of linear regression include the following:
- It doesn't work well if the data isn't truly independent.
- ML linear regression is prone to underfitting that doesn't account for rare events.
- Outliers can skew the accuracy of linear regression models.
Key assumptions of linear regression
Linear regression requires the data set to support the following properties:
- Data needs to be organized as a continuous series, such as time, sales in dollars or advertising spend. It doesn't work directly with data that comes in the form of categories like days of the week or product type. Measurements should be made consistently.
- The response variable forms a linear relationship between parameters and the predictor variables. Since predictor variables are seen as fixed values, the linearity is just about setting parameters properly.
- Observations need to be truly independent of each other. For example, sales and profits might not be independent if the cost of goods or other factors don't affect profits separately.
- Data needs to be cleansed of any outliers or rare events -- data quality issues.
- The amount each data point varies from the straight line needs to be consistent over changes in the independent variable. This constant variance is called homoscedasticity.
- Although observations or data points are random values, the predictor variables can be treated as fixed values. This is called weak exogeneity.
Linear regression tools
Linear regression methods can be performed on paper, but the process can be cumbersome and involve repetitive sums and squares. Higher education and professional applications of linear regression equations typically employ software applications to ingest data and perform the required mathematical processes quickly. Linear regression is supported by numerous software tools and programming libraries, including the following:
- Dedicated statistical software packages such as IBM SPSS Statistics.
- Matlab.
- Microsoft Excel.
- R linear regression.
- Scikit-learn.
Linear regression vs. logistic regression
Linear regression is just one class of regression techniques for fitting numbers onto a graph.
Multivariate regression might fit data to a curve or a plane in a multidimensional graph representing the effects of multiple variables.
Although logistic regression and linear regression both use linear equations for predictions, logistic regression predicts whether a given data point belongs to one class or another, such as spam/not spam for an email filter or fraud/not fraud for a credit card authorizer.
Learn what supervised, unsupervised and semisupervised learning are and how machine learning algorithms are used in various business applications.