Grafana vs. Datadog: What are the differences?
Grafana and Datadog are both powerful monitoring services with a wide variety of integrations, such as logging, visualization, alerts and APM.
Monitoring tools can make it easier to respond to issues, understand the health and security of a running system, or even plan enhancements to that system that would affect its performance.
Grafana and Datadog are two different tools that you can use for monitoring purposes and to consume and visualize information from different logging services, both on premises and in the cloud.
It depends on the budget, timelines and scale of your organization if either of these could be useful tools for monitoring your application and the infrastructure it runs on. No matter which you pick, you spend a significant amount of time to configure each data source, dashboard and alarm. Once you fully configure either tool, you have a powerful window into your application and infrastructure.
Set up logging
Setting up logging looks different for everyone, but the first step is to have some kind of logging agent or service setup. If you don't have anything setup, stop reading this article, and configure that first.
If you are running AWS, Azure or Google Cloud, you need to use Amazon CloudWatch, Azure Monitor or Google Cloud Logging, respectively. If you are running Kubernetes, you need Consul, Istio or some other way to read logs from your cluster. If you're running on premises, you need to set up Elasticsearch with Logstash or Prometheus to collect events and metrics from each instance.
Both Grafana and Datadog have options to set up instance logging using the command line if you don't want to go through the setup of additional services.
No matter which platform you use, there are plugins and integrations in both Grafana and Datadog that can take the data, aggregate it, and render it in a graph or trigger an alert. The core of any monitoring tool is built on the logs that it is monitoring.
Grafana
Now that you have logs to parse, the next step is to pick a tool to work with. One option is Grafana. Grafana has several different options to set it up, including the following:
- Linux, macOS or Windows install.
- Docker or Docker Compose.
- Grafana Cloud, a SaaS offering managed by Grafana Labs.
- Marketplace offerings in all major cloud providers.
The instructions and pricing vary depending on how you choose to install Grafana. Each step is laid out in extensive documentation. Whatever option you choose, you are taken to a start page similar to the one here.
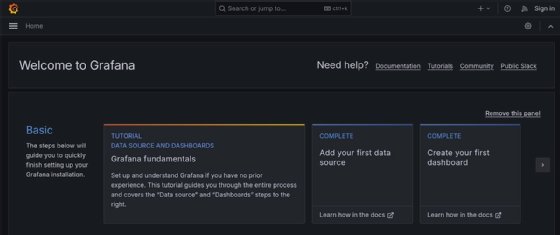
The screenshots and examples in this article use Docker Compose, connecting to locally hosted Linux VMs and AWS. Each offering can be configured the same way. Once you're at the home page, you need to do two things: add data sources and create dashboards.
Data sources
The logging tools you set up earlier are the data sources that power your Grafana dashboard. Open the Home menu on the top-left side of the screen. Then, navigate to Connections > Data Sources, and add a new data source.
This menu shows what plugins are available for the different logging and monitoring services that Grafana can create dashboards from. There are several options to choose from here. For the purposes of this article, the focus is on AWS and Grafana Labs' own Linux server logging tool, Loki.
Server logging
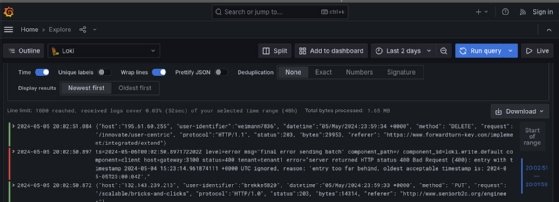
Loki is a server logging utility you can install as an agent on a Linux VM from the apt and dnf package managers or run in a Docker container alongside Grafana. Once you configure Grafana, the system logs are sent to Grafana, where they can be seen on display.
AWS
CloudWatch already has access to several different metrics from your AWS account with minimal configuration. Practically any event or log from any AWS service can be sent to CloudWatch. Several services log to CloudWatch events by default.
To configure CloudWatch in Grafana, you need to create an AWS Identity and Access Management (IAM) principal for your Grafana dashboard. This can either be a role or a user with an access key and a secret access key. Once that's done, you can enter the details for that role or the access keys for the user into the data sources page in Grafana.
Once you configure either of these data sources, Grafana enables you to explore the data in them by creating SQL-like queries against the data in them. This enables you to create views for specific pieces of information in those logs.
Dashboards
Once you have data sources that send logs to Grafana, it's time to build some dashboards. Grafana doesn't have any charts by default for any data sources. Instead, use SQL queries to parse incoming data from each data source. If you don't want to spend time configuring a dashboard yourself, you can import templates for common dashboards from the community.
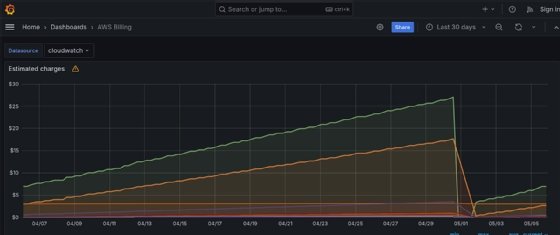
These templates can be a good place to start out. Even if one dashboard doesn't fit your exact needs, you can customize it after you import. There are community dashboards for many different cases, including cloud billing, storage utilization, deployment monitoring and others, such as the one here that uses CloudWatch data to show estimated billing charges by service.
It can be a challenge to build dashboards from SQL queries from scratch. But, if you save them as templates, it can be a great way to version them, make improvements over time and also to share them with other users and organizations using Grafana who might have similar needs.
Pricing
At the time of writing, Grafana has several different pricing tiers. The Grafana instance itself is not billed for. But any functionality outside of the free tier is invoiced under the pay-as-you-go plan.
There is an Advanced plan that starts at $299 per month with double the capacity of the free tier, as well as 24/7 support.
Datadog
While Grafana can be set up on premises or in a completely isolated environment, Datadog needs to report back to its cloud platform, where all the management and configuration work is done.
Aside from interface and connectivity requirements, the largest difference between Grafana and Datadog is licensing. Whereas Grafana licensing is on a per-instance basis, Datadog has several different services that you can subscribe to. Depending on which services you choose and how much you use them, the price you pay for Datadog varies.
Data sources
Datadog has several of the same integrations that Grafana has. These integrations are configured in the same ways. For example, an AWS integration can use either an IAM role or user with access keys. If you connect individual VMs, Datadog provides an agent that can install with a single CLI command.
By comparison, the agent installation that Datadog provides is a much smoother experience than Grafana's Loki agent. It's the first thing you do to set up your Datadog account. When you create a new Datadog account, one of the first prompts is to install the Datadog agent onto a machine you want to monitor.
Server logging
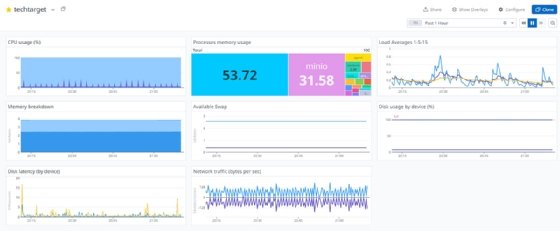
Once you install the Datadog agent, you can already start monitoring your instance. Datadog has several preconfigured graphs with the relevant metrics and statistics from each connected host. They're visible as soon as those hosts start to report back without any need to configure on your part.
If you have a lot of resources to configure or don't want to spend an entire sprint to set up the relevant data points on a dashboard, this is a simpler option compared to the labor-intensive setup of Grafana dashboards.
AWS
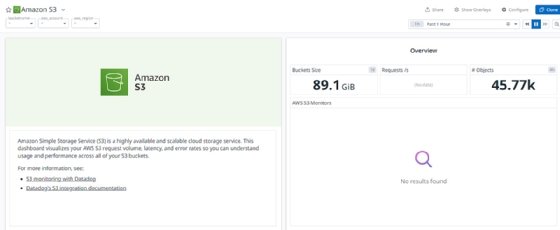
When you set up Datadog's integration with Amazon CloudWatch, several different dashboards are automatically created for you. Depending on what kinds of metrics you hope to gather about your account, the default settings may or may not be useful to you.
The example bucket shown in the chart here is for backup and archive and does not need constant monitoring. Datadog can't tell what the purpose of each piece of your infrastructure is, but makes charts for each service.
Dashboards
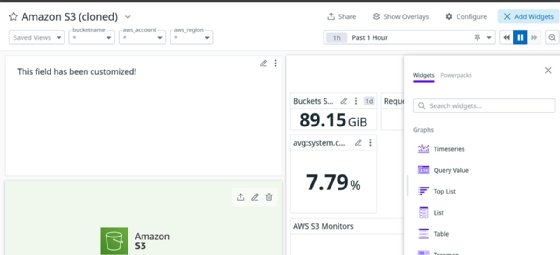
Datadog does a lot of work to preconfigure the dashboards for each integration so that the setup time for onboarding new accounts and plugins is minimal. That doesn't mean that you're stuck with the graphs it gives you if they don't work for your needs. You can copy and customize each graph.
Once you configure each dashboard to your liking, you can export it as JSON so it can be versioned or backed up. This makes it just as flexible as Grafana's dashboard offerings.
Pricing
DataDog's pricing structure takes time to understand as a new user. Each type of service monitored has different pricing tiers with different features. Depending on how many services you need to integrate and how many resources you want to monitor, costs can add up quickly.
Before you onboard, choose which resources should be monitored and at what level. Then, slowly increase while you keep an eye on monthly charges. Otherwise, the costs for using Datadog can balloon quickly, which makes it far more expensive than any of the Grafana tiers when you configure incorrectly.
Christopher Blackden got his first IT job at the age of 15 and has since held positions in several different disciplines, including systems administration and software engineering. Currently, he's a DevOps engineer at Children's Hospital of Philadelphia.
Dig Deeper on IT systems management and monitoring
-
![]()
New Grafana Labs features aim to simplify observability
By: Eric Avidon
-
![]()
Confluent Current 2024: StarTree integrates real-time analytics for observability
By: Adrian Bridgwater
-
![]()
Evaluate Grafana vs. Kibana for IT data visualization
By: Christopher Blackden
-
![]()
Compare 8 tools for IT monitoring in 2024
By: Will Kelly